Grid Layer Range
The grid layer range options for presenting data for a given grid layer.
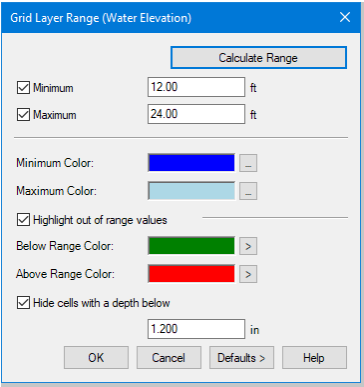
- Calculate Range and Minimum/Maximum – The Calculate Range will automatically determine the minimum and maximum value for the current grid layer across all grid cells (and if applicable, for all time steps). The values are always applied to the minimum and maximum fields regardless of the check state. If minimum and/or maximum are checked, the user can enter their own values for the range.
- Minimum/Maximum Color – Each layer has a factory default minimum and maximum color. These colors are used to create a gradient starting at the minimum and ramping up to the maximum values. These colors apply to all participating grid cells at the current time step. The Minimum and Maximum colors can be changed by the user.
- Highlight out of range values – The user can optionally provide a color to use when the value of a grid cell is below the given minimum or above the given maximum. If using the calculated minimum and maximum values, these colors do not apply. In addition to any color the user selects, Transparent is also available. This will be displayed on a menu that opens when the [>] button is clicked.
- Velocity Arrows – These options apply only to the velocity arrows layer. However, you can show the velocity arrows even if an input grid layer (i.e., elevation or Manning’s n) is selected. The arrows will represent the velocity direction at the current time step. The size is determined by the velocity. The arrows are only displayed if the Show Velocity Arrows option is ticked in the grid browser and if there are results available for the current scenario. The grid layer range options for velocity arrows are accessible from the […] button to the right of the Show Velocity Arrows checkbox.
- Minimum/Maximum Size – The size factor to use to display the velocity arrow in a grid cell. Typically, lower velocities are shown as smaller arrows and higher though the minimum factor can be larger than the maximum factor if so desired.
- Arrow Color – the color of the arrow in the grid.
- Below/Above Range Color – if the velocity value is below the minimum value, then it will use below range color for the array. If the velocity is above the maximum, it will use the above range color for the arrow.
- Hide cells with a depth below: This option is available for the water elevation layer only. When checked any depth below the value shown will automatically be drawn as transparent. The default depth is 0.0. The value is initialized to the calculation option "Minimum Depth on Grid" when the calculate range button is clicked. When the option is unchecked, the depth field is read-only.
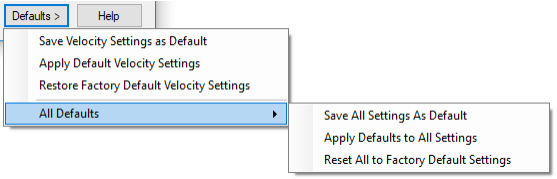
- Defaults – When
clicked, opens a context menu providing actions to save, apply and restore
defaults.
- Save Settings As Default – saves the current settings in the dialog to an external xml file specific to the layer (note the layer in the dialog title).
- Apply Default Settings – If the user settings for the current layer are available, reads the settings from the file and applies them. Only if the Minimum or Maximum options are ticked, will the minimum and/or maximum values be applied. If the file containing the user defaults for the layer does not exist, the factory defaults are applied.
- Restore Factory Default Settings – Resets the layer options to factory defaults.
- All Defaults – This menu provides a way to save, apply and reset the settings for all layers at once. Save will save the current settings for each layer to its individual settings xml file. Apply will read the settings for the appropriate file, if the file exists, and apply it to the appropriate layer. If the file does not exist, the factory defaults are applied. Reset all to factory defaults will reset all layers to the respective factory defaults.