Grid Browser (Platforms)
The grid browser for the platforms (AutoCAD, MicroStation CONNECT Edition, ArcGIS Pro and ArcMap) is a special dialog that allows for the viewing of the 2D computation grid and 2D modeling results.
The grid browser is accessible by using the Grid Browser command. In AutoCAD, MicroStation CONNECT Edition and ArcGIS Pro, this is available on the 2D Modeling tab. In ArcMap, this is available on the 2D Modeling toolbar or the 2D Modeling menu.
Grid Browser
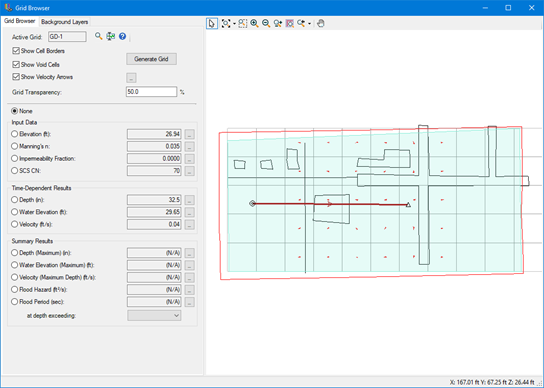
The grid browser, shown above, has your grid information shown on the left. This is the same information as found in the grid browser in the stand-alone platform. As you move your mouse over the grid in the drawing, the data will automatically update showing the value for the grid cell under the mouse.
You can also, optionally, show the grid cell borders, void cells and velocity flow arrows. The velocity flow arrows will only display if you have 2D modeling results available.
The toolbar to the right of the active grid label provides three (3) buttons. The first will zoom to the active grid in the drawing. The second will open the time browser as a floating window. The third will open this help topic.
If a time-dependent layer is selected, you can use the time browser to change the time step. The drawing will automatically update to show results at that time step. Also note that if you have any element symbology (applies to AutoCAD and MicroStation CONNECT Edition platforms) or platform specific symbology (like that of ArcGIS Pro and ArcMap), changing the time step will also update that information as well.
The layers in the input data section are from the 2D computational grid. As you move the mouse over the computational grid the information is retrieved from the grid cell under the mouse and displayed.
The layers in the time-dependent results section will show the value under the mouse for the current time step. This will use the results grid. The 2D computational grid and results grid are independent and you can have one and not the other.
The layers in the summary results section will show the results across all time steps for the cell under the mouse.
In the bottom-right corner of the window shows the x, y and z of the mouse position. The z value represents the elevation in the terrain model at the mouse’s location. If the mouse is outside the terrain model boundary, no z value is shown.
Background Layers
On the background layers tab, you have access to the background layers manager. This is the same background layer manager available in the stand-alone platform. With the background layer manager, you can add a variety of background layers including Bing Maps. Refer to the Using Background Layers topic for more information.