Performance Study
Page 2 – Pump SCADA Data to Analyze
The second page of the pump study feature is used to set the range of values to be used in the study and to display the tabular SCADA values used.
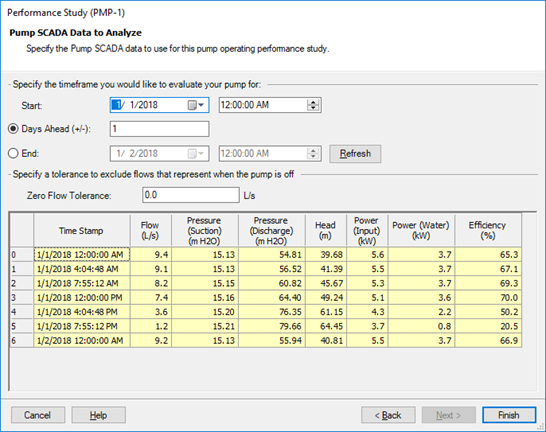
This page retrieves the data from the SCADA signals and displays it in the provided table. Several of the columns are automatically calculated based on other data in the table.
The head data is calculated by the difference between the suction and discharge hydraulic grade. This calculated value is stored in length units and displayed in the selected display unit.
If the user used Level for either the suction or discharge, a column showing the level signal values will be shown instead of pressure.
If the user opted to compute the pump efficiency, then the Power (Input), Power (Water) and Efficiency columns are included. The Power (Water) and Efficiency values are calculated based on the Flow, Head and Power (Input) values.
Power (Water) is calculated using the following equation:
Power (Water) = Flow * Head * 62.4 * (1/ 737.56)
Once the Power (Water) value is calculated, the efficiency is calculated as the ratio between Power (Water) and Power (Input) and displayed as a percentage.
The date/time range is initialized based on the start date of the pump flow signal selected. The Days Ahead field is provided to specify how far from the start date/time the user wants to retrieve the SCADA data.
Instead of specifying the number of days ahead, the user can also specify an exact end date. Simply click the [o] End radio button and enter the end date and time in the available fields.
Once the start and end date and times are specified, click the Refresh button to read the SCADA data and populate the table.
The zero flow tolerance value represents the pump flow rate corresponding to the status of off. Any value at or below this value is not loaded into the table. This is a way to filter the data to exclude those times when the pump was not pumping or simply had no power but there was still occurring non-zero value reported such as due to zero drift or imprecision.
In some SCADA systems, the time stamp for the flow reading may not exactly match with the time stamp for pressure or power values. In these cases, the time stamp of the flow data is used in the first column and the signal from the time closest to the flow signal time is used for the other signals. For example, if flow is reported at 5:05:11 and pressure is reported at 5:06:22 and 5:04:58, the second signal is closest to the flow signal and is used. The time tolerance set on the SCADA data source is used to determine the range of values to check for the closest date/time stamp of the flow date/time.
Click Finish to close the wizard and open the pump performance study graph window.