T.3 Stress Contours
Stress contours are a color-based plot of the variation of stress or moment across the surface of the slab or a selected portion of it.
-
On the
Results ribbon tab, select the
Plate Stress tool in the
View Results group.

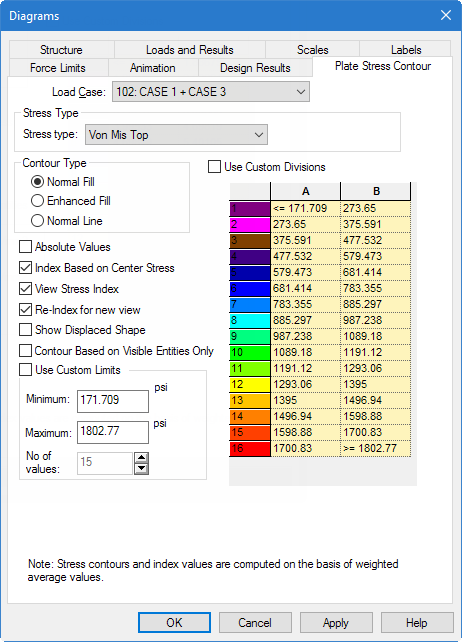
The Diagrams dialog opens to the Plate Stress Contour tab. -
Select the load case number from the
Load Case drop-down list.
Stress values are known exactly only at the plate centroid locations. Everywhere else, they are calculated by linear interpolation between the center point stress values of adjacent plates.
The Enhanced type contour chooses a larger number of points compared to the Normal type contour in determining the stress variation.
- Select the specific type of stress for which you want the contour drawn from the Stress type drop-down list.
-
Setting the
View Stress Index option will display a small
table consisting of the numerical range of values from smallest to largest
which are represented in the plot.
- Load case — 102: CASE 1 + CASE 3
- Stress Type — Von Mis Top
- Contour Type — Normal Fill
- Index based on Center Stress checked
- View Stress Index checked
- Re-Index for new view checked
- Click Apply.
- (Optional) If some portion of the structure appears truncated, use the Zoom and Pan tools located on the View toolbar to adjust the display.