T.2 Viewing the force and moment diagrams
-
Select the
Beam Results page on the
Postprocessing page control bar.
Note: You can display force and moment diagrams on most results pages by selecting corresponding tool from the View Result group on the Results ribbon tab. The corresponding tool remains depressed when the diagram is displayed.The bending moment MZ is drawn on the structure by default. The Beam End Forces table and Beam Force Detail table open. T.2 The Beam Forces Table for details on these tables.
-
To change the force or moment (i.e., degree of freedom) diagram
displayed, either:
select the corresponding diagram tool from the View Result group on the Results ribbon tab
or
select Structure tool in the Configuration group on the Results ribbon tab and then select the degrees of freedom to display from the Beam Forces group on the Loads and Results tab.
- (Optional) If the force or moment diagram is not exaggerated enough to clearly identify, you can change the scale:
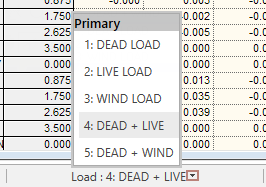
- To change the load case being displayed, select from the current Load list in the window status bar.
-
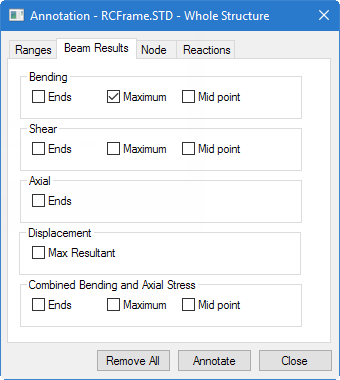
Annotate the bending Z moment diagram to display the maximum
moment in the beams for load case 5:
- Select . The Annotation dialog opens.
- On the Ranges tab, select the Ranges option and then type 2 5 (spaced node number list) in the Beams field.
- Select the Beam Results tab and then check the Maximum option in the Bending group.
-
Click
Annotate and then click
Close.
The bending Z moment diagram is annotated for load case 5, as in the following figure.
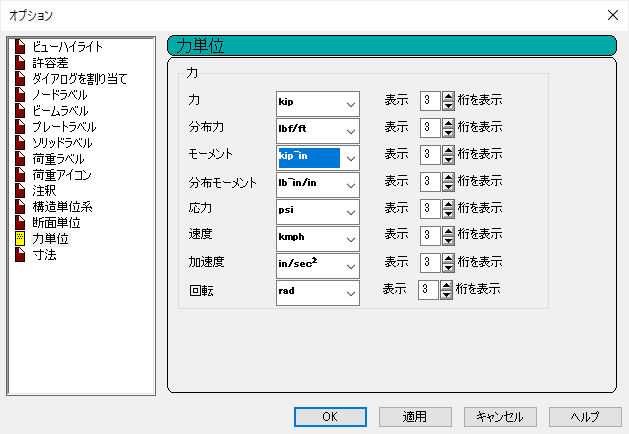
- Change the display units for bending moments: The units in which results values are displayed in the post-processing mode are referred to as the display units.


 in the